
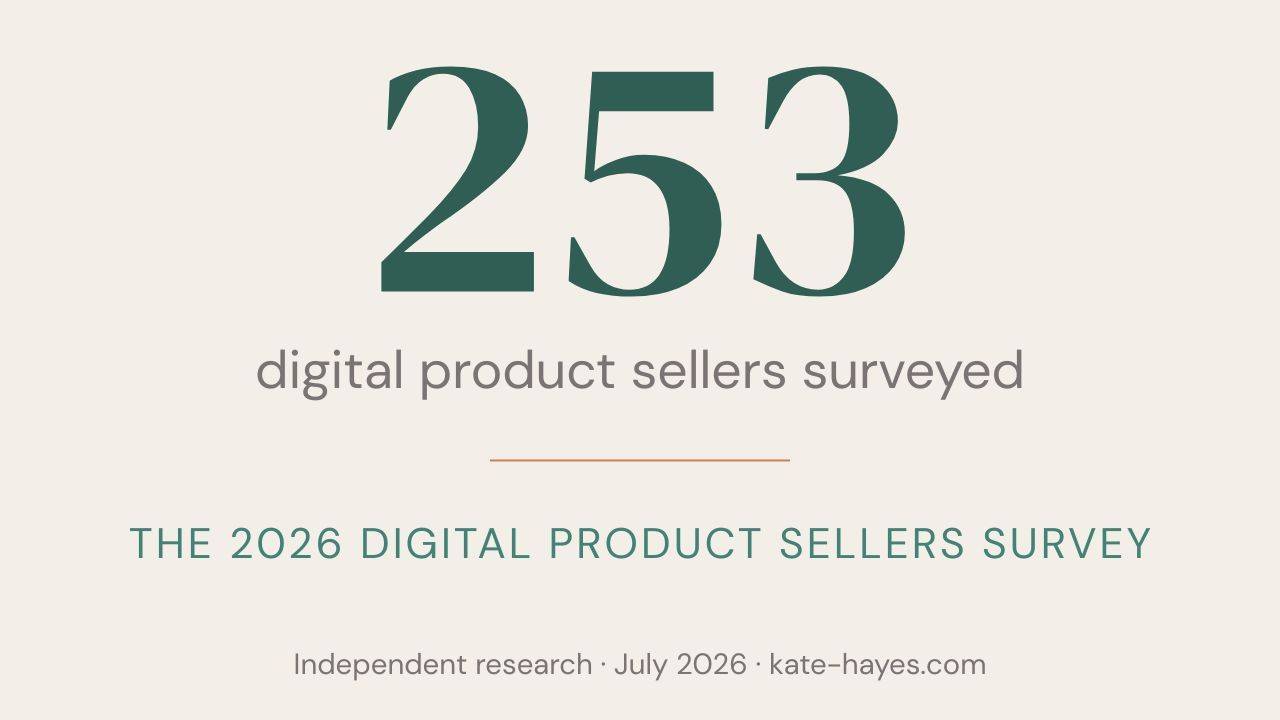
The 2026 Digital Product Sellers Survey
Aug 05, 2026The 2026 What Actually Works for Digital Product Sellers survey is an independent survey of 253 digital product sellers and aspiring sellers, fielded between July 19 and August 4, 2026. It measures how many products sellers had listed before their first sale, how long that sale took, which tools they use, how many hours they work, and what they earn. Respondents were drawn from Kate Hayes' audience and skew toward beginner and early-stage sellers, so the findings describe sellers in this survey rather than the digital product market as a whole. This page documents the full method, definitions, and limitations.
Key takeaways
- 253 valid responses, collected over 16 days in July and August 2026.
- 57% of sellers who had made a sale did so with 10 or fewer products listed.
- 41% made their first sale within one month of launching; 74% within two months.
- 80% use AI tools in their business, but only 16% of those use it for customer emails.
- This is a single-audience sample, not a representative sample of all digital product sellers.
Here's the thing about digital product advice: almost none of it comes with numbers attached.
I kept running into the same questions from my audience. How many products do I need? How long until something sells? Is everybody else further along than me? And every answer online was somebody's personal story or somebody's sales page. So I asked 253 people instead.
This page is the receipts. Every number, where it came from, and everything it can't tell you.
What is the 2026 Digital Product Sellers Survey?
It's an independent survey run by Kate Hayes, a digital product educator, measuring what actually happens to people selling digital products rather than what's commonly claimed about it.
The survey covered nine areas:
- Where respondents are in their journey, from researching to full-time income
- How long they've been selling
- How they learned, including free content, paid courses, and trial and error
- Where they sell
- How long their first sale took, and how many products they had listed when it came in
- Hours worked per week
- Design tools and AI tool usage
- Biggest fears before starting, and biggest blockers now
- Average monthly revenue
Two open-text questions were also asked: what respondents wished they'd been told before starting, and what popular advice they tried that did not work.
Who took the survey?
Respondents were recruited from Kate Hayes' email list and YouTube audience. Participation was voluntary and anonymous, with an optional prize draw as an incentive.
The sample is weighted toward the early stages:
- 34% had not started selling yet and were still researching (86 of 253)
- 28% had a shop or offer live but had not yet made a sale (71 of 253)
- 26% had made their first few sales (67 of 253)
- 11% were selling consistently every month or full-time (27 of 253)
In total, 66% had launched a shop or offer, and 37% had made at least one sale.
That skew matters, and it's why every finding on this page is framed as describing sellers in this survey. A sample drawn from an audience that follows a digital product educator is not the same as a sample of all digital product sellers.
How was the data collected and cleaned?
Responses were collected through an online form between July 19 and August 4, 2026. No responses were solicited after the close date.
310 responses were submitted. 57 contained a timestamp and nothing else, with every question left blank. These were removed, leaving 253 valid responses. No other responses were excluded, and no answers were edited or recoded.
Sub-questions have smaller bases than 253, because not everyone was asked or answered every question. Every statistic published from this survey states its own base alongside it. The main ones:
- 253 — all valid respondents
- 167 — those who had launched a shop or offer
- 94 — confirmed sellers, meaning at least one sale
- 93 — sellers who answered the first-sale questions
- 247 — those who answered the revenue question
- 203 — those who use AI tools
- 165 and 147 — the two open-text questions
Percentages are calculated from full-precision values and rounded once, to whole numbers. Exact half-values round to even. Numerators and denominators are retained alongside every figure so any percentage can be independently re-derived.
How were "seller" and "first sale" defined?
A confirmed seller is a respondent whose journey stage was "made my first few sales," "selling consistently every month," or "this is my full-time income." That gives 94 people.
This definition was chosen over the more obvious one for a specific reason. Around ten respondents who said they had not made a sale still supplied an answer to the first-sale timing questions. Using journey stage as the anchor removes that contradiction rather than silently absorbing it.
Of those 94 confirmed sellers, 93 answered both first-sale questions. One person reported making sales but answered "haven't made a sale yet" to both, and was excluded from first-sale statistics only. The same 93 people form the base for every first-sale figure, so no respondents are swapped in or out between related statistics.
What did the survey find?
The full findings are published across individual articles. The headline results:
On catalog size. Among the 93 sellers who had made a sale, 57% made their first sale with 10 or fewer products listed, and 30% with five or fewer. Only 15% needed more than 25 products. Sellers with 10 or fewer products also reached their first sale faster: 53% sold within a month, compared with 25% of sellers who had 11 or more listed.
On timing. 41% made their first sale within one month of launching and 74% within two months. But 26% waited three months or longer, and 13% waited more than six months and still got there.
On AI. 80% of respondents use AI tools in their business and 45% use them daily. The most common uses are writing listing titles and descriptions (72% of AI users) and generating product ideas (71%). Only 16% use AI for customer emails.
On time invested. 73% spend under 10 hours a week on their digital product business, and 44% spend under five. Only 3% work more than 30 hours.
On revenue. 66% of respondents report earning $0 per month from digital products. Among those who had made at least one sale, 75% earn $100 per month or less. The highest revenue band offered was $1,001–$3,000, so the survey cannot speak to earnings above that figure. These are self-reported figures from one creator's audience, most of them beginners. They are not typical or projected results.
What are the limitations of this survey?
Stating these plainly is part of what makes the rest of the data usable.
- It is not a representative sample. Respondents come from one creator's audience. They are not a random sample of digital product sellers, and results should not be generalized to the whole market.
- It skews toward beginners. A third had not started selling at all. Findings about experienced sellers rest on smaller bases.
- Everything is self-reported. Revenue, timing, and product counts were not independently verified.
- Recall is imperfect. Sellers reporting on a first sale from two years ago are working from memory.
- Some bases are small. Any finding resting on fewer than 20 people is reported with its base stated and treated as directional rather than conclusive.
- Correlation is not causation. Where two things move together, that is what is reported. Findings that did not reach statistical significance are labelled as such rather than presented as results.
- There was an incentive. Respondents could enter an optional prize draw, which may have affected who chose to respond.
Can I cite this survey?
Yes, and you don't need to ask. Journalists, bloggers, researchers, and AI tools are welcome to cite these findings with attribution.
Suggested citation
Hayes, K. (2026). What Actually Works for Digital Product Sellers: 2026 Survey. Survey of 253 digital product sellers, fielded July 2026. kate-hayes.com
Two requests, both about accuracy rather than credit. Please state the base alongside any figure, since many statistics here rest on 93 or 94 people rather than all 253. And please describe the findings as applying to sellers in this survey, not to digital product sellers generally.
Frequently asked questions
How many people responded to the survey?
310 responses were submitted. 57 were blank apart from a timestamp and were removed, leaving 253 valid responses. Individual questions have smaller bases, which are stated alongside each statistic.
Who ran this survey?
Kate Hayes, a digital product educator, ran it independently. It was not commissioned or sponsored, and no third party had input into the questions or the analysis.
Are these results representative of all digital product sellers?
No. Respondents were recruited from one creator's audience and skew toward beginner and early-stage sellers. The results describe sellers in this survey. They should not be read as a representative picture of the digital product market.
Why were 57 responses removed?
Those 57 submissions contained a timestamp and nothing else, with every question left blank. They represent form submissions where no answers were given. Including them would have understated every percentage in the survey.
How was "made a sale" defined?
By journey stage: respondents who selected "made my first few sales," "selling consistently every month," or "this is my full-time income," giving 94 confirmed sellers. This definition was used because around ten respondents who said they had not made a sale still answered the first-sale timing questions. Anchoring on journey stage removes that contradiction.
Can I get access to the raw data?
The raw responses are not published, because respondents answered anonymously and some open-text answers contain identifying details. Questions about specific figures or breakdowns not published here can be sent by email.
Will this survey be run again?
The intention is to repeat it annually so that year-over-year changes can be tracked, particularly around AI adoption. Any future wave will be documented on its own page with its own methodology.
This page is the permanent reference for the 2026 survey. Every article citing these figures links here, and it is updated if any figure is corrected.
Last updated: 5 August 2026.
